
Rivian Prometheus Exporter

The Unofficial Rivian Prometheus Exporter
Prometheus provides custom collectors to generate metrics to include in Observability platforms, you can write the exporters in supported client libraries.
I have written the Rivian Prometheus Exporter using the python client. You can deploy it using the Kubernetes resources below as well.
In the exporter, we have only one gauge (battery %) and couple of other counter metrics exposed.
The Adventure
Section titled “The Adventure”- Code Up Rivian Exporter in Python for Prometheus.
- Dockerize the exporter, build container.
- Deploy on Kubernetes
- Scrape The Whip Metrics
- Inspect the Data Outcome
Implementation
Section titled “Implementation”The exporter is written in python and uses the rivian_api library to get the data from the vehicle.
rivian_exporter.py
import timefrom prometheus_client.core import GaugeMetricFamily, REGISTRY, CounterMetricFamilyfrom prometheus_client import start_http_serverimport rivian_api as rivianimport osimport jsonimport random
class RivianExporter(object):    def __init__(self):        self.rivian = rivian.Rivian()        response = self.rivian.login(            os.environ['RIVIAN_USERNAME'],            os.environ['RIVIAN_PASSWORD']        )        # owner info, grab rivian vehicleid        owner = self.rivian.get_user_information()        self.rivianid = owner['data']['currentUser']['vehicles'][0]['id']        print(f'Rivian: {self.rivianid}')
    def collect(self):
        # status info        whipstatus = self.rivian.get_vehicle_state(self.rivianid)
        # battery level - batteryLevel        # distance to empty - distanceToEmpty        # gear status - gearStatus
        batterylevel = whipstatus['data']['vehicleState']['batteryLevel']['value']        distancetoempty = whipstatus['data']['vehicleState']['distanceToEmpty']['value']        gearstatus = whipstatus['data']['vehicleState']['gearStatus']['value']
        # Metric Translations        if gearstatus == 'park':            gearstatus = 0        else:            gearstatus = 1

        a = GaugeMetricFamily("rivian_battery_level", "% of Battery left", labels=['whip'])        a.add_metric([self.rivianid], batterylevel)        yield a
        b = CounterMetricFamily("rivian_battery_distance_empty", 'Miles Left', labels=['whip'])        b.add_metric([self.rivianid], distancetoempty)        yield b
        c = CounterMetricFamily("rivian_gear_status", '0=park, otherwise rolling...', labels=['whip'])        c.add_metric([self.rivianid], gearstatus)        yield c

if __name__ == '__main__':    start_http_server(8000)    REGISTRY.register(RivianExporter())    while True:        REGISTRY.collect()        # lets not piss off the Site Reliability Teams at Rivian        time.sleep(90)
I am exposing the static gauge and counter metrics. But you can just modify it with your logic from another system.
In second step we will build our Docker container.
Container
Section titled “Container”Container build.
Dockerfile
FROM python:3.8
ADD src /src
RUN pip install prometheus_clientRUN pip install plotlyRUN pip install polylineRUN pip install python-dateutilRUN pip install python-dotenvRUN pip install requestsRUN pip install geopy
WORKDIR /src

ENV PYTHONPATH '/src/'ENV RIVIAN_PASSWORD 'secret'ENV RIVIAN_USERNAME 'k8s'
CMD ["python" , "/src/rivian_exporter.py"]
Now build it, and push.
docker build -t rivian-prometheus-exporter .docker image tag rivian-prometheus-exporter sween/rivian-prometheus-exporter:latestdocker push sween/rivian-prometheus-exporter:latestNow that we have a container pushed, we can use it in our deployment.
Kubernetes
Section titled “Kubernetes”In the last third step you can deploy the collector on Kubernetes.\
deployment.yaml
apiVersion: apps/v1kind: Deploymentmetadata: name: rivian-prometheus-exporter-deployment labels: app: rivian-prometheus-exporterspec: replicas: 1 selector: matchLabels: app: rivian-prometheus-exporter template: metadata: labels: app: rivian-prometheus-exporter spec: containers: - name: rivian-prometheus-exporter image: sween/rivian-prometheus-exporter:latest ports: - containerPort: 5000 env: - name: RIVIAN_PASSWORD valueFrom: secretKeyRef: name: rivian-user-pass key: rivian_password - name: RIVIAN_USERNAME valueFrom: secretKeyRef: name: rivian-user-pass key: rivian_usernameNext is the service, I use MetalLB as it is my favorite thing ever basically, but expose the socket any which way you fancy.
service.yaml
apiVersion: v1kind: Servicemetadata: name: rivian-prometheus-exporter-servicespec: selector: app: rivian-prometheus-exporter type: LoadBalancer # NodePort or whatever ports: - protocol: TCP port: 5000 targetPort: 8000Create a namespace and add your Rivian Credentials as a secret:
kubectl create ns riviankubectl create secret generic rivian-user-pass -n rivian \ --from-literal=rivian_username='ron.sweeney+api@hotmale.com' \ --from-literal=rivian_password='12345' # same as your luggageApply the Deployment and LoadBalancer (or NodePort)
kubectl apply -f deploy/* -n rivianIf everything worked out, we should see a pair of fonzies running on our cluster for the deployment and the MetalLB LoadBalancer Service.
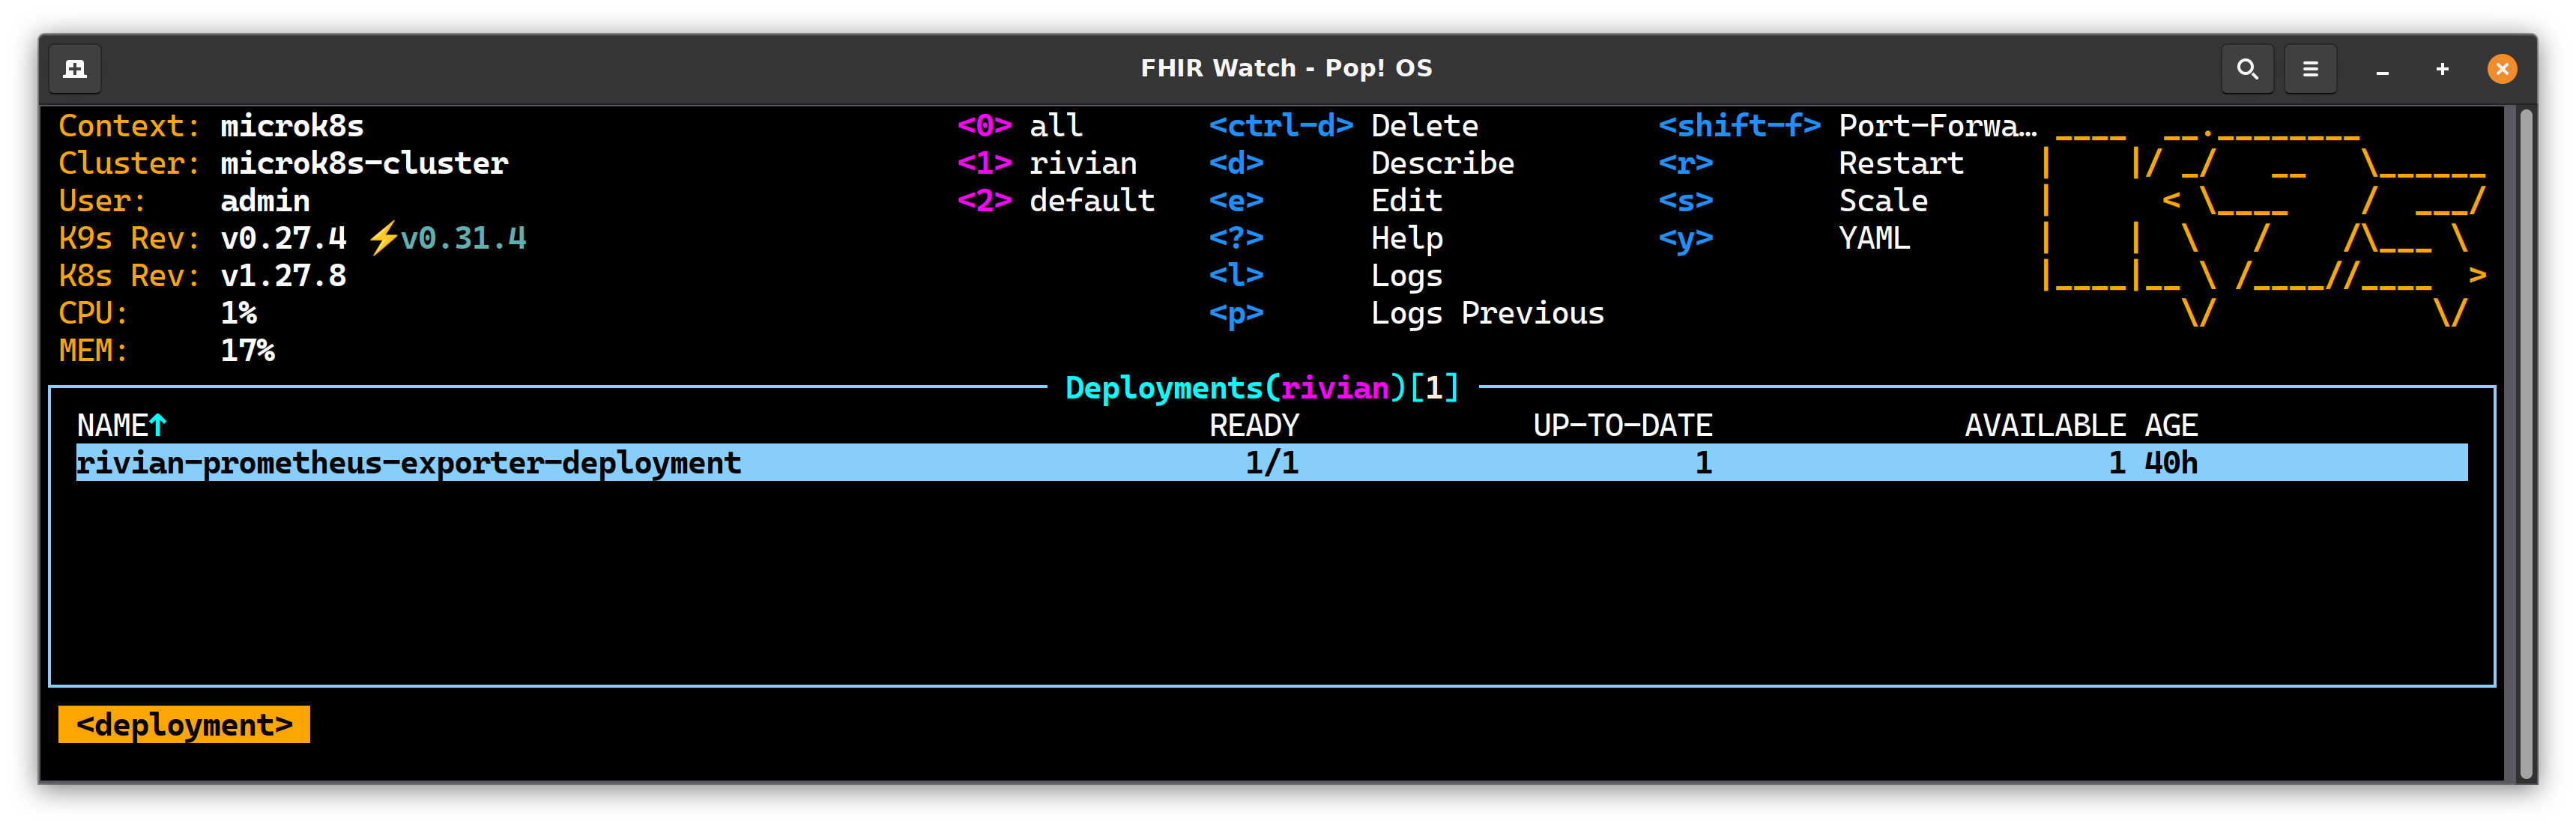
Deployment Ready
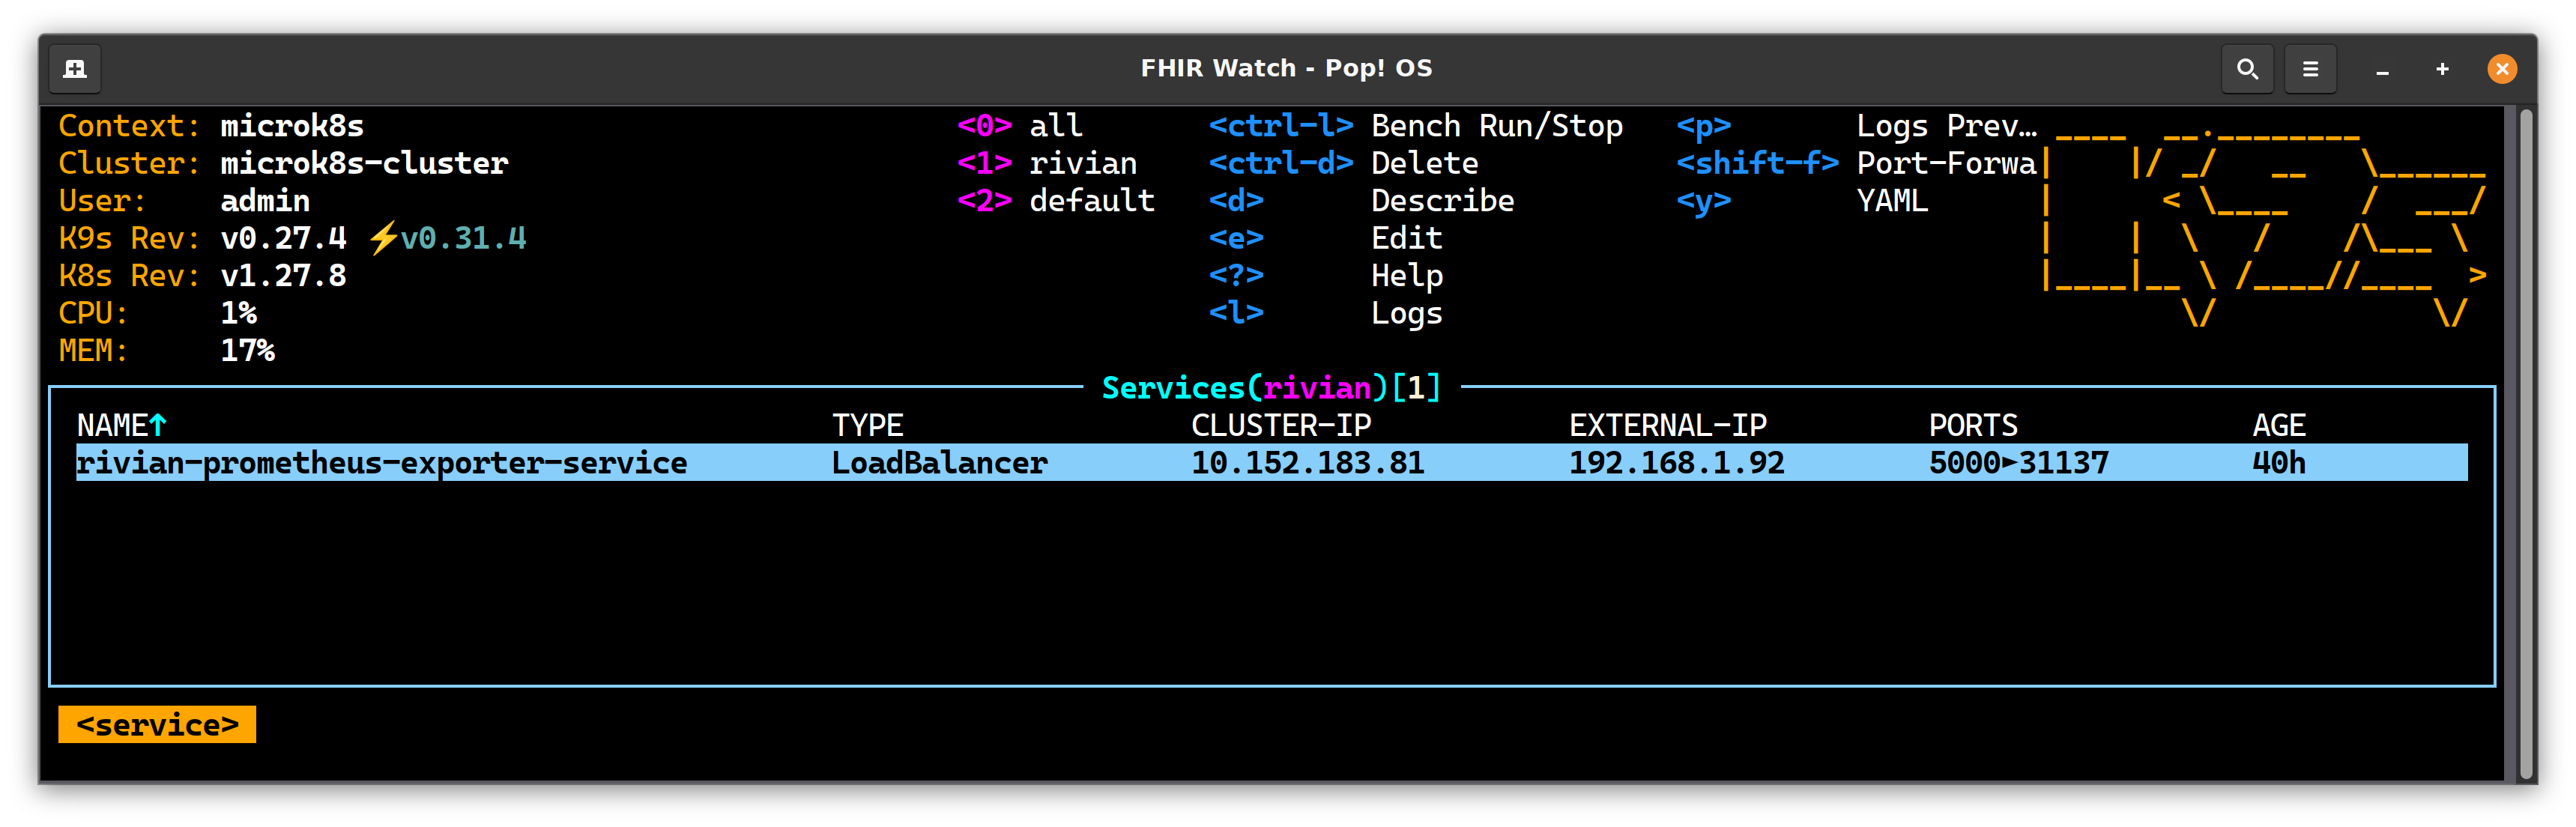
Services Ready
The Attestation
Section titled “The Attestation”Now hit the MetalLB Load balancer on port 5000 and bask in the glory of the exported metrics.
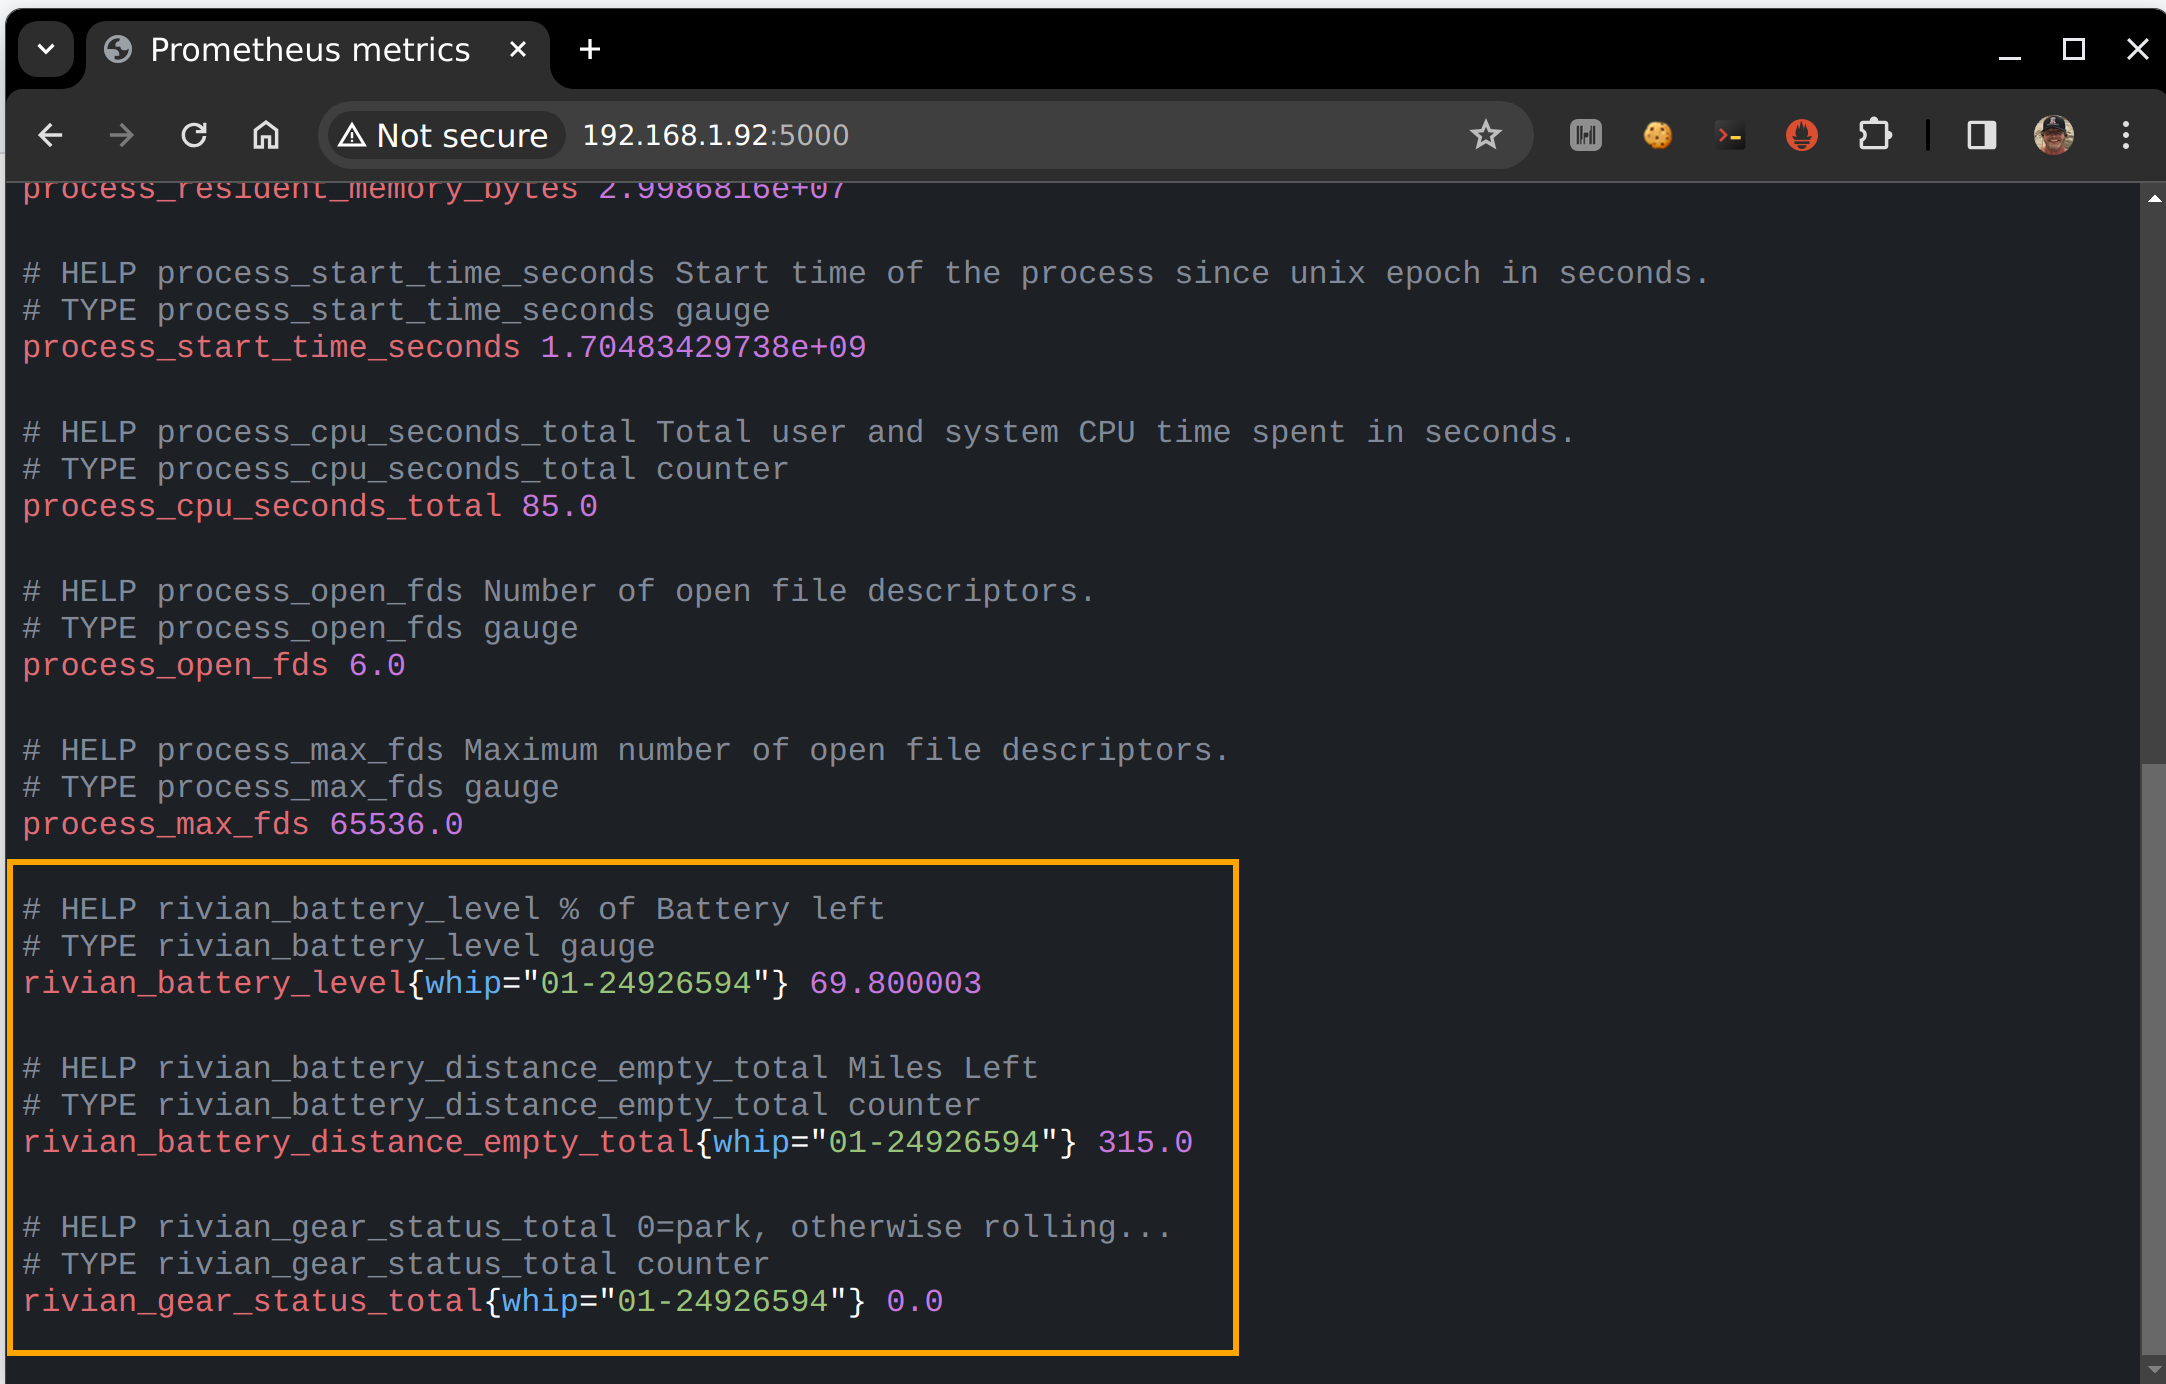
Notice the sweet name spacing with my Vehicle Id
Though, awesome, most arent impressed by metrics endpoints, but get set to get even more unimpressed looking at a round trip of errands using prometheus to explore the data.
You need to define a simple prometheus.yml
# Sample config for Prometheus.global: scrape_interval: 30s # By default, scrape targets every 15 seconds. evaluation_interval: 30s # By default, scrape targets every 15 seconds. # Attach these labels to any time series or alerts when communicating with # external systems (federation, remote storage, Alertmanager). external_labels: monitor: 'deezwatts'# A scrape configuration containing exactly one endpoint to scrape:# Here it's Prometheus itself.scrape_configs: # The job name is added as a label `job=<job_name>` to any timeseries scraped from this config. - job_name: 'deezwatts' # Override the global default and scrape targets from this job every 5 seconds. scrape_interval: 30s scrape_timeout: 30s static_configs: - targets: ['192.168.1.92:5000'] metrics_path: /Then run it and hit http://localhost:9090 to explore the data time series in Prometheus.
docker run \ -p 9090:9090 \ -v $PWD/prom/prometheus.yml:/etc/prometheus/prometheus.yml \ prom/prometheusLets inspect the data running a couple of errands in the Whip.
So its like 3:PM or so EST, and I needed to go to the store, along the way, I stopped at Taco Bell, then drove home to Gun Lake. Total trip was about 20 miles or so, with 2 stops.
Gun Lake -> Taco Bell -> Grocery Store -> Gun Lake
Distance to Empty
Section titled “Distance to Empty”I hope you appreciate the simplicity here, but prometheus told the story of my errands run… I started out with a full charge with an extended setting, drove 10 miles, did two stops very close to each other, then drove it back 10 miles. You can even see where I did some drive way shuffling before I plugged it in to charge to Standard.
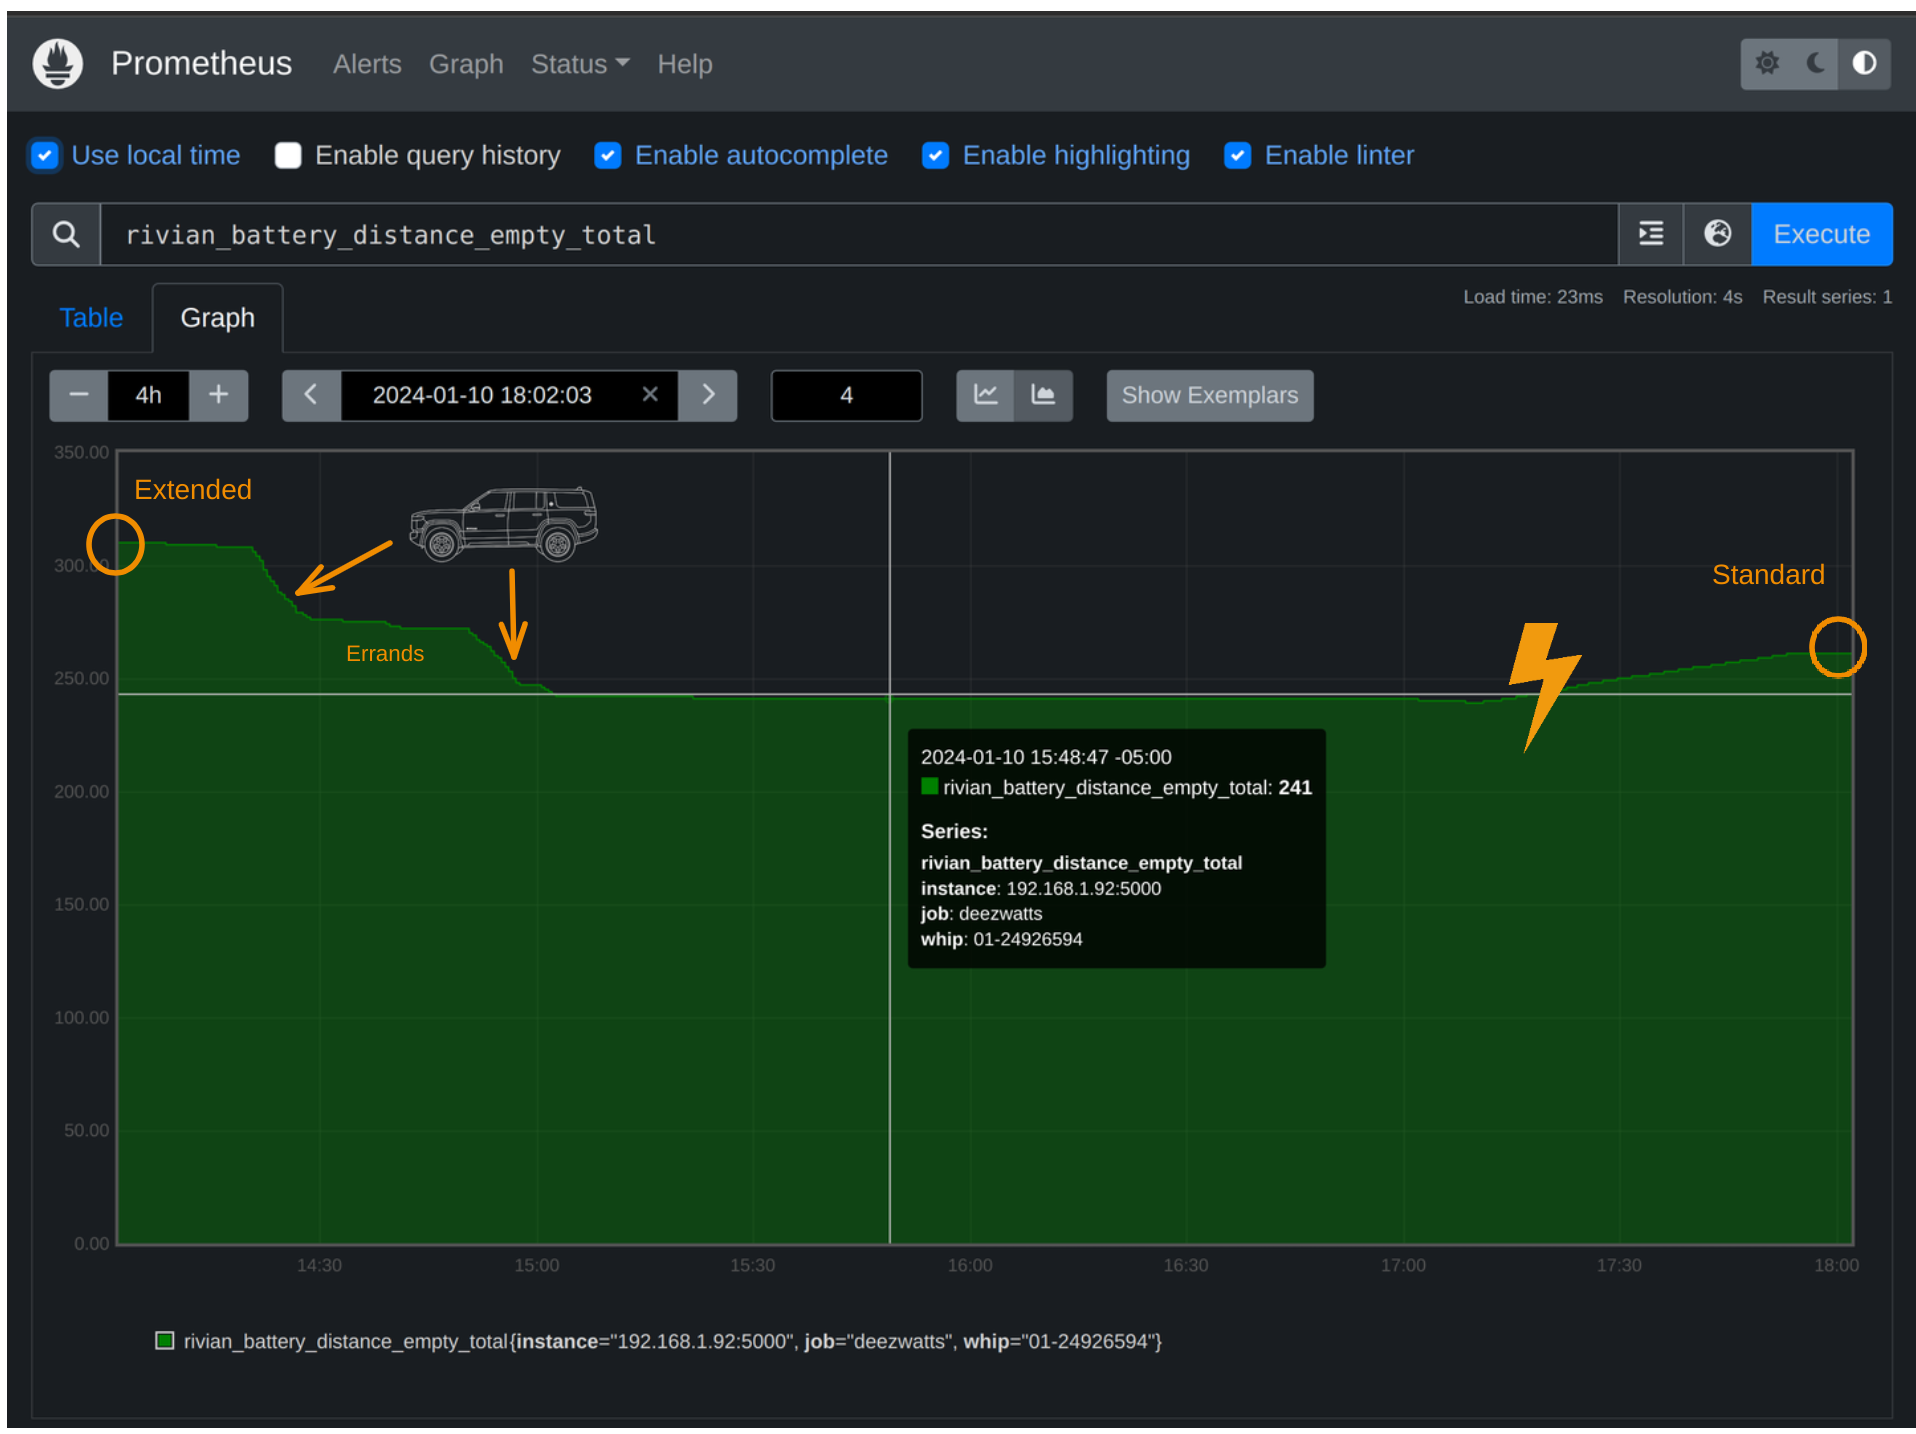
Distance to Empty
Gear Status
Section titled “Gear Status”This one wont win any visualization awards, but if you recall the metric we did was 0 = P, and anything else is 1 = in motion (whether backwards or forwards). You can clearly see the 3 errands and the park shuffling in the gear status as well.
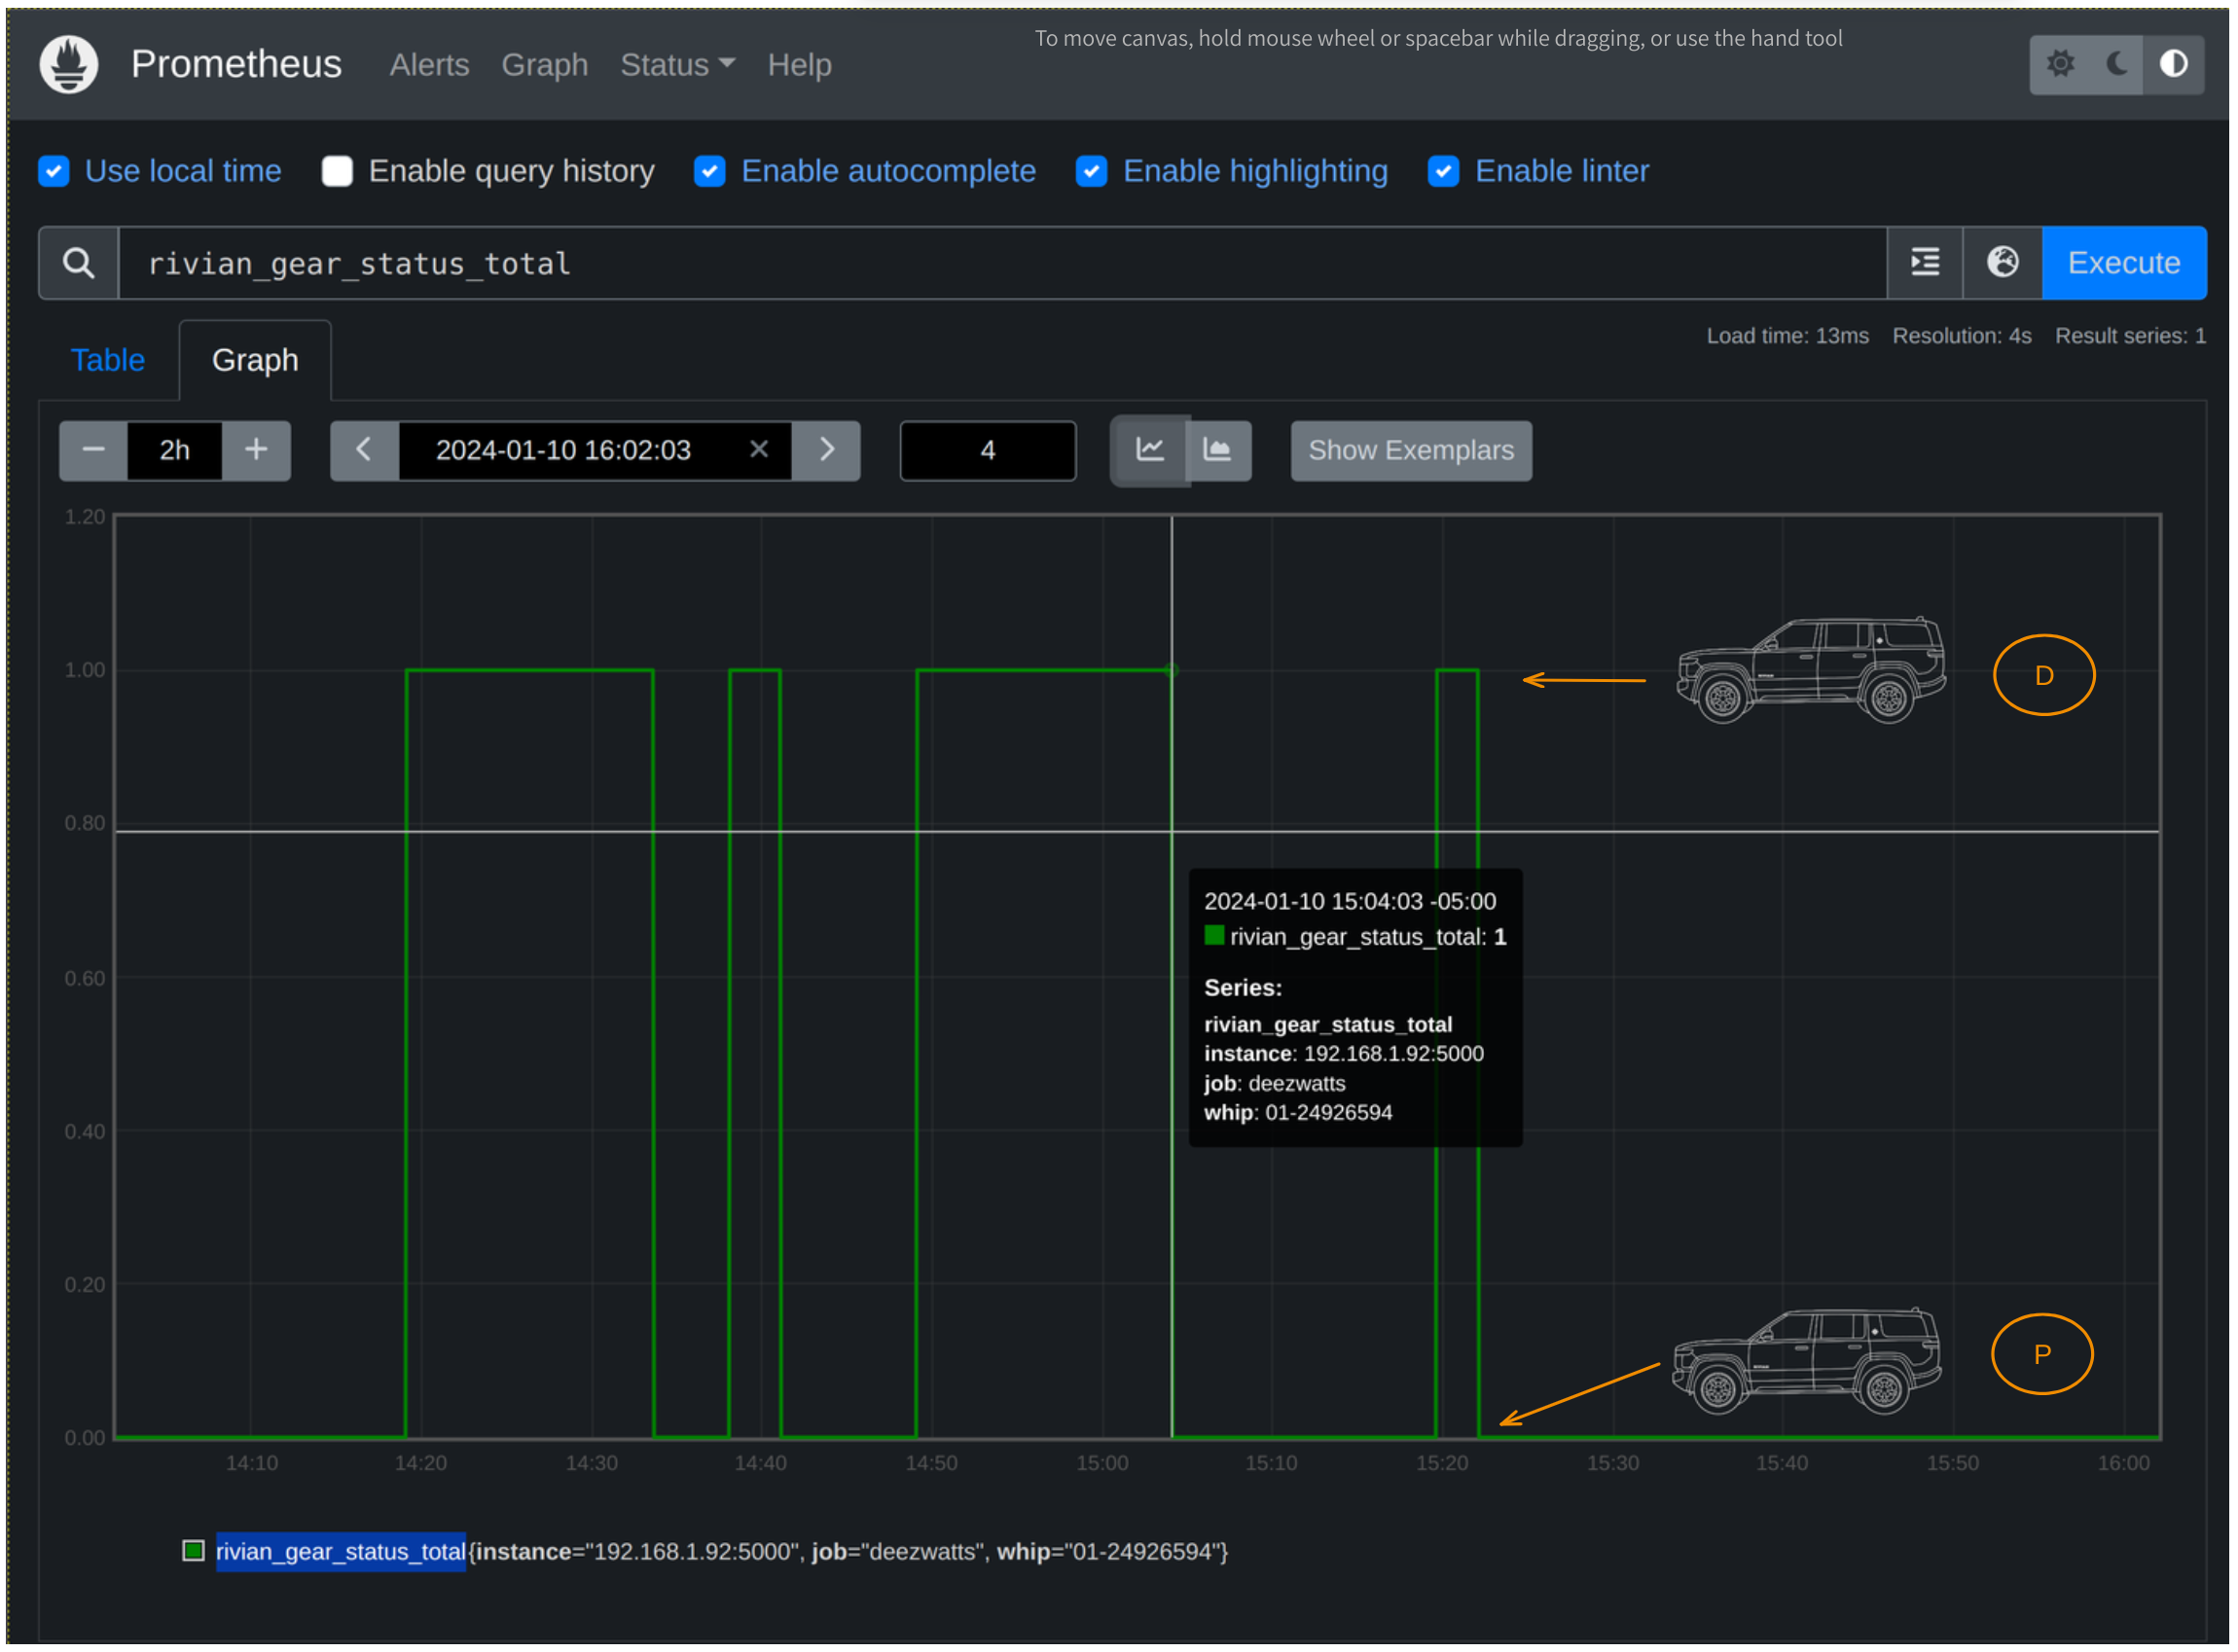
Gear Status
Everything you see here available on Github